
 Available in US
Content
The Invisible Infrastructure of Every Golf Bet
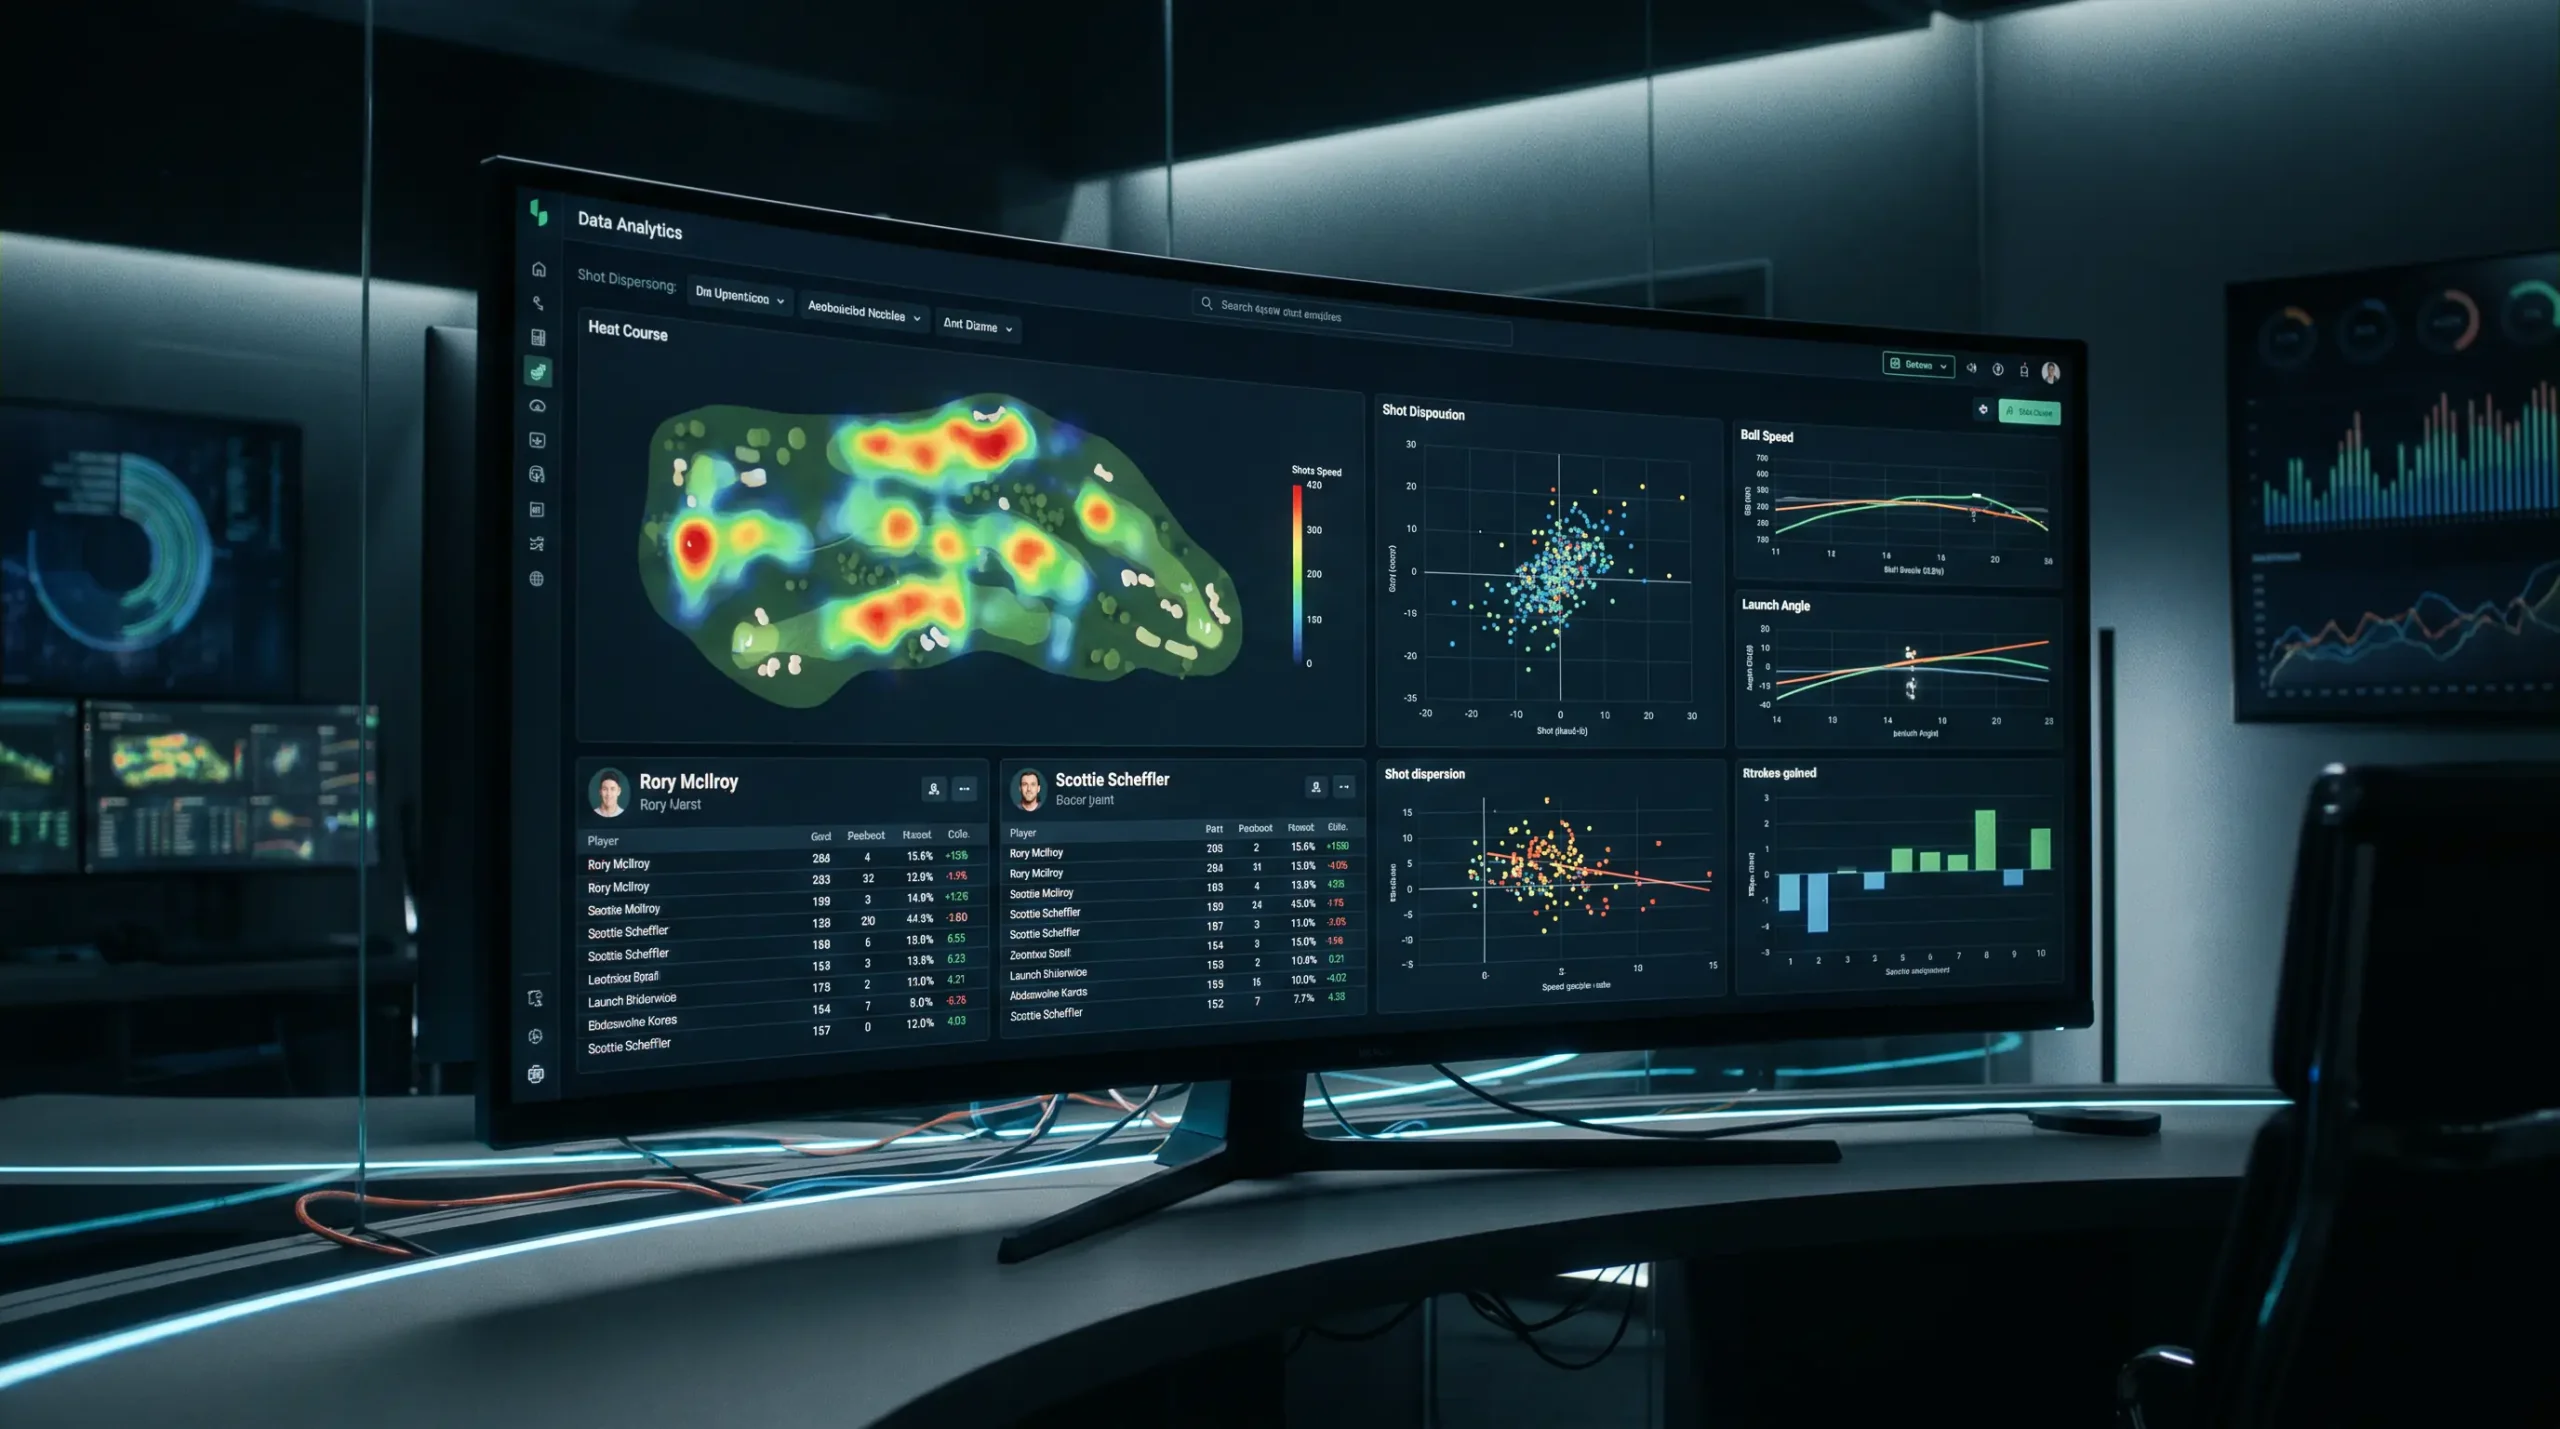
Every time you tap “place bet” on a golf market, a chain of data systems fires behind the scenes that most punters never think about. I spent a weekend mapping out the pipeline from shot tracking to odds compilation, and the complexity genuinely surprised me. The price you see on your screen is the end product of satellite positioning, laser measurement, statistical modelling, and real-time data feeds that connect tour venues to bookmaker trading desks in under two seconds.
Understanding this infrastructure is not academic. It tells you where the data is strong and where it has gaps, which markets are priced from deep statistical models and which are held together by educated guesswork. That knowledge changes how you bet.
ShotLink and the PGA Tour Data Machine
I remember the first time I saw raw ShotLink data — thousands of rows for a single tournament, every shot measured to the nearest inch. ShotLink is the PGA Tour’s proprietary shot-tracking system, and it captures the position of every ball at rest during every round of every PGA Tour event. Laser-based systems and volunteer spotters record where each shot starts, where it finishes, and the distance between the two. That data is the foundation of Strokes Gained, the analytical framework that revolutionised how we evaluate golfers.
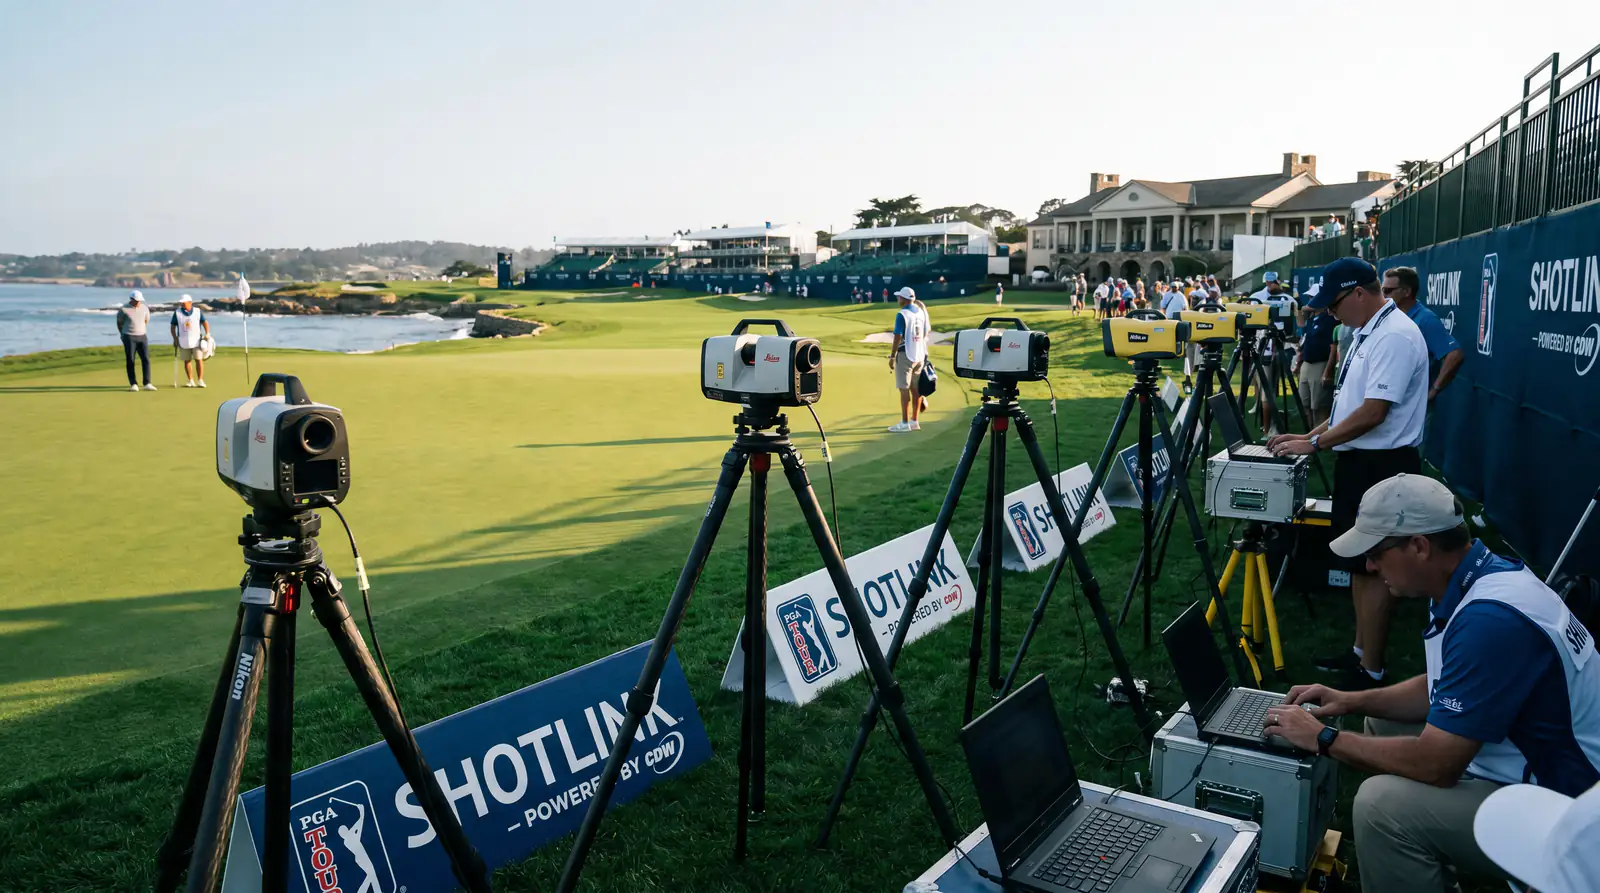
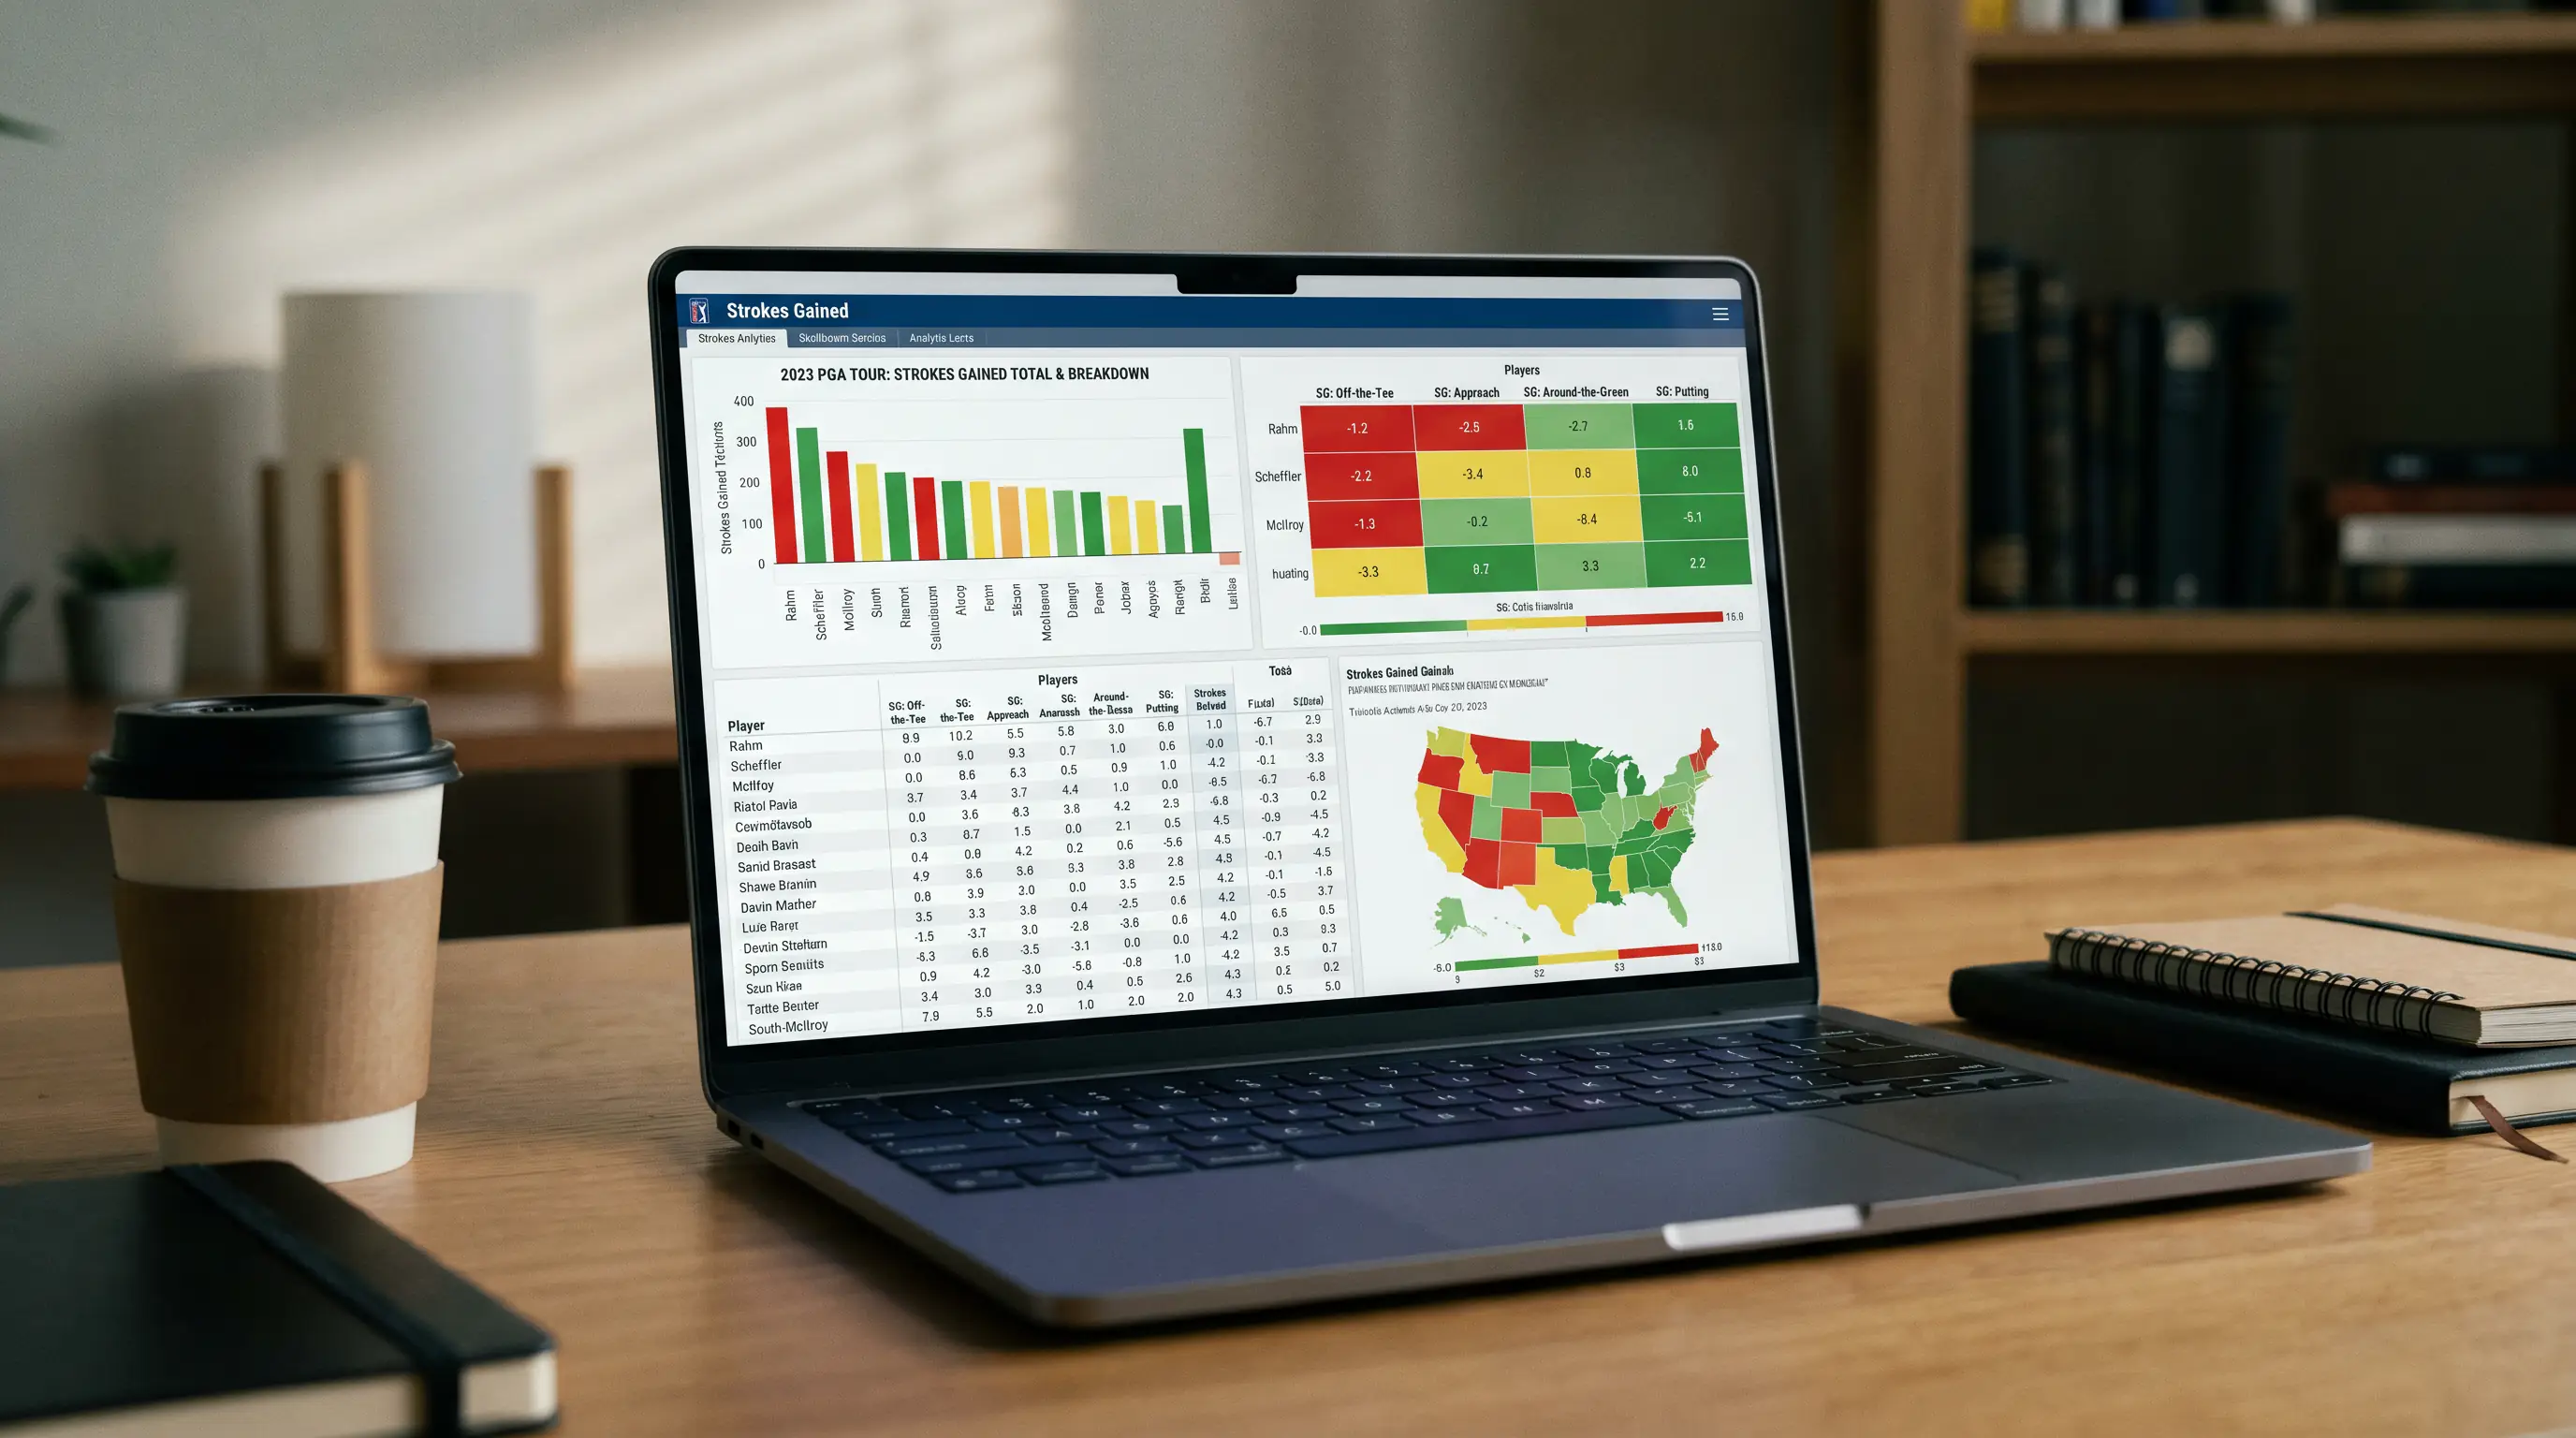
The depth of ShotLink data is staggering. For any given player, you can pull their Strokes Gained breakdown across tee shots, approach shots, around the green, and putting — segmented by course, by hole, by lie type, by distance to the pin. That granularity is what enables bookmakers to price hole-by-hole micro-markets and round-specific props. Without ShotLink, the entire advanced golf betting ecosystem would not exist in its current form. The PGA Tour Betcast expanded to more than 400 hours across twelve tournaments in 2026, and every second of that broadcast is powered by ShotLink feeds.
Sportradar, IMG Arena and the Data Distribution Layer
Raw data is useless without a distribution network. This is where companies like Sportradar and IMG Arena sit in the chain. Sportradar holds expanded data agreements with the PGA Tour, the DP World Tour, and the R&A, processing shot-tracking data and packaging it into feeds that bookmakers can integrate into their pricing models. Sportradar plans to stream more than 700,000 live events across all sports in 2026, and golf’s share of that volume is growing fast as micro-market demand increases.

IMG Arena provides the audiovisual layer — the 3D shot tracking, the animated ball flights, the real-time leaderboard overlays that sportsbooks embed in their in-play products. Over 75% of Sportradar’s major betting clients already use IMG Arena content. The combination of Sportradar’s data and IMG Arena’s visualisation creates the product that punters actually interact with: a live betting interface where you can watch a shot land and see the odds update within seconds.

For UK bettors, the practical implication is that DP World Tour events and Open Championship qualifying are now covered by official data agreements. The gap between PGA Tour data coverage and European tour coverage has narrowed significantly. Events at Wentworth, The Belfry, and links courses across the UK are feeding into the same data infrastructure that powers PGA Tour markets, which means the pricing on European events is becoming sharper and more data-driven with each season.
Where the Data Falls Short
Here is something the industry does not advertise: not all tours have equal data coverage. The Asian Tour, the Sunshine Tour, and many Challenge Tour events operate without ShotLink-level shot tracking. Markets for those events are priced from a thinner data base — leaderboard results, basic scoring statistics, and the trader’s qualitative judgement. That creates a different kind of opportunity. If you follow a lower-tier tour closely enough to have your own informal scouting notes, your edge over the bookmaker is larger than on the PGA Tour, where every trader has access to the same granular data you do.
Weather data is another area where the infrastructure has improved but remains imperfect. Bookmakers incorporate forecast data into their pre-round pricing, but wind speed and direction can shift within a round, and the models that adjust in-play prices for weather changes are still evolving. I have noticed that afternoon wave prices in exposed links courses often lag behind actual weather deterioration by 20 to 30 minutes — a window that alert in-play bettors can exploit. The Strokes Gained betting guide explains how to layer weather-adjusted performance data into your own analysis.
How Bookmakers Use This Data to Set Odds
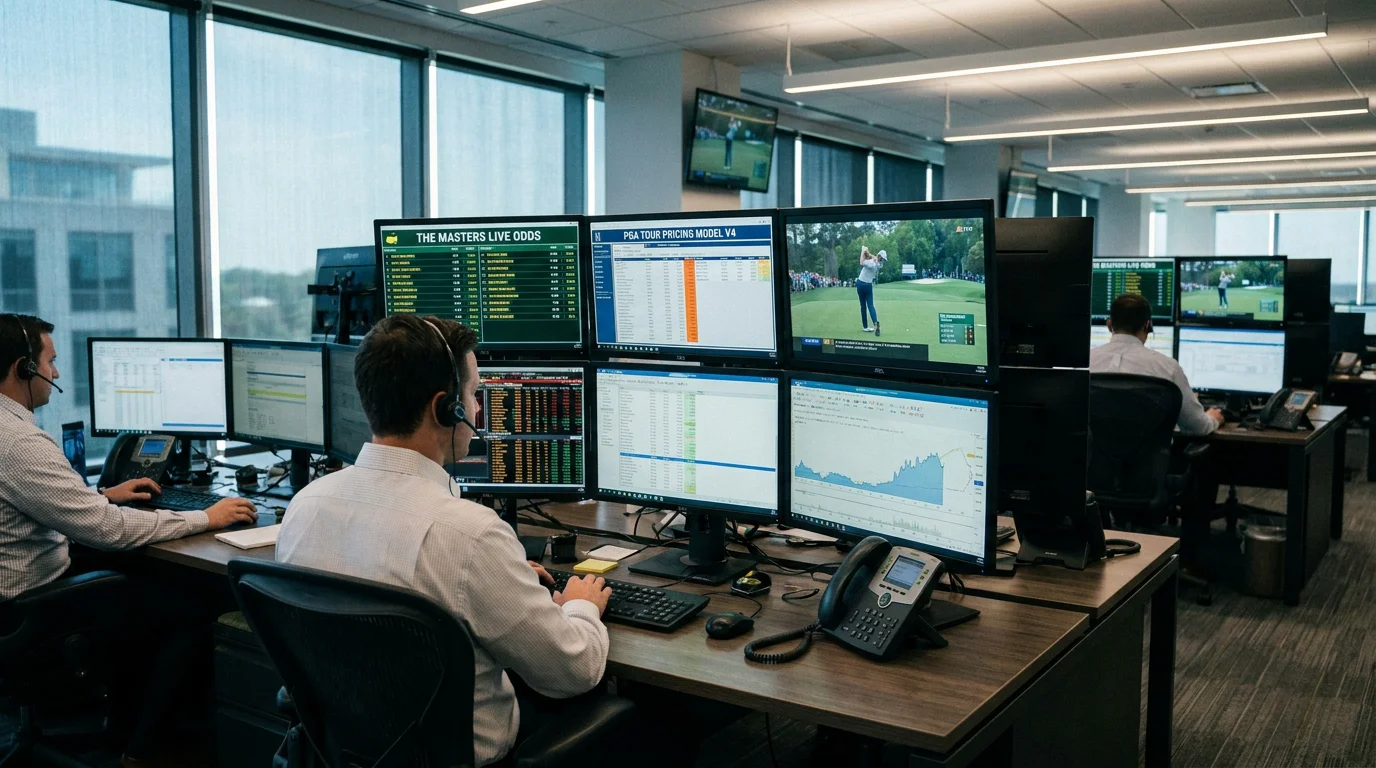
A bookmaker’s golf trading desk works differently from football or tennis. The sheer number of players in a golf field — 156 in a standard PGA Tour event — means the odds compiler cannot individually assess every runner with the same depth. Instead, trading desks use algorithmic models that ingest ShotLink data, OWGR rankings, recent form, and course history to generate an initial set of prices. Those prices are then reviewed and adjusted by a human trader who applies qualitative factors: injury whispers, equipment changes, caddie switches, and market intelligence from how money is flowing.
The top 20 or so players in any field receive the most attention from both the model and the human overlay. The middle of the field — players ranked 40th to 100th in the market — receives less individual scrutiny, which is precisely where pricing errors are most likely to persist. The pro golf market reached $7.6 billion globally in 2025, and as that volume grows, bookmakers are investing more in automated pricing models. But the tail of the distribution — longshots, debutants, players returning from injury — still depends heavily on human judgement, and human judgement has blind spots.
The practical takeaway: if your analytical process focuses on the same top-tier players that the bookmaker’s best models and sharpest traders are dissecting, your edge is thin. If you apply the same analytical rigour to the 50/1 to 150/1 range, where the bookmaker’s model is less confident and the human overlay is thinner, the probability of finding mispriced selections increases meaningfully.
Is ShotLink data available to the public?
Basic ShotLink-derived statistics are available through the PGA Tour’s official website and various third-party analytics platforms. Full raw ShotLink data is licensed commercially and not freely accessible. However, the derived metrics — Strokes Gained breakdowns, proximity to hole, driving accuracy — are widely available and sufficient for building a robust betting model.
Do European tour events have the same data quality as PGA Tour events?
The gap is narrowing. Sportradar’s expanded agreement with the DP World Tour and the R&A means official shot-tracking data is increasingly available for European events. However, Challenge Tour and lower-tier events still operate with less granular data than PGA Tour events, which affects both the quality of bookmaker pricing and the analytical tools available to bettors.
