
 Available in US
Content
Golf Odds Carry More Information Than You Think
Most punters look at golf odds and see a price. I look at them and see an argument — the bookmaker’s argument about how likely a given outcome is, expressed in numbers, with a profit margin baked in. Learning to read that argument, question it and occasionally disagree with it is the difference between punting and investing.
Golf odds are unlike any other sport’s pricing. In a football match, two or three outcomes share the probability space. In tennis, it’s two. In golf, 156 individual outcomes compete for the same 100% of probability in the outright market, plus dozens of additional markets — matchups, top finishes, first round leader, cut lines — each with their own pricing logic. The PGA Tour’s betting handle grew by 20% in 2025 for the fourth consecutive year of double-digit growth, and that expanding money pool pushes bookmakers to price more markets with more granularity than ever before.
The practical consequence is that golf odds contain more exploitable information — and more exploitable errors — than odds in simpler sports. A football match might have three outcomes priced by dozens of sophisticated models. A golf outright market has 156 outcomes, many of which are priced semi-automatically based on generic player rankings and recent results rather than event-specific analysis. The further you move from the market leaders (the top 5-10 players by odds), the less attention the bookmaker’s pricing team has devoted to each individual line. That inattention creates gaps.
Over the next sections, I’ll walk through how to read golf odds in both fractional and decimal formats, how bookmakers construct their pricing for a 156-player field, where the margin hides, and how to compare lines across operators to find the best available price. If you’re treating odds as a fixed input rather than a variable to interrogate, you’re leaving money on the table.
Fractional vs Decimal: Reading Both Formats
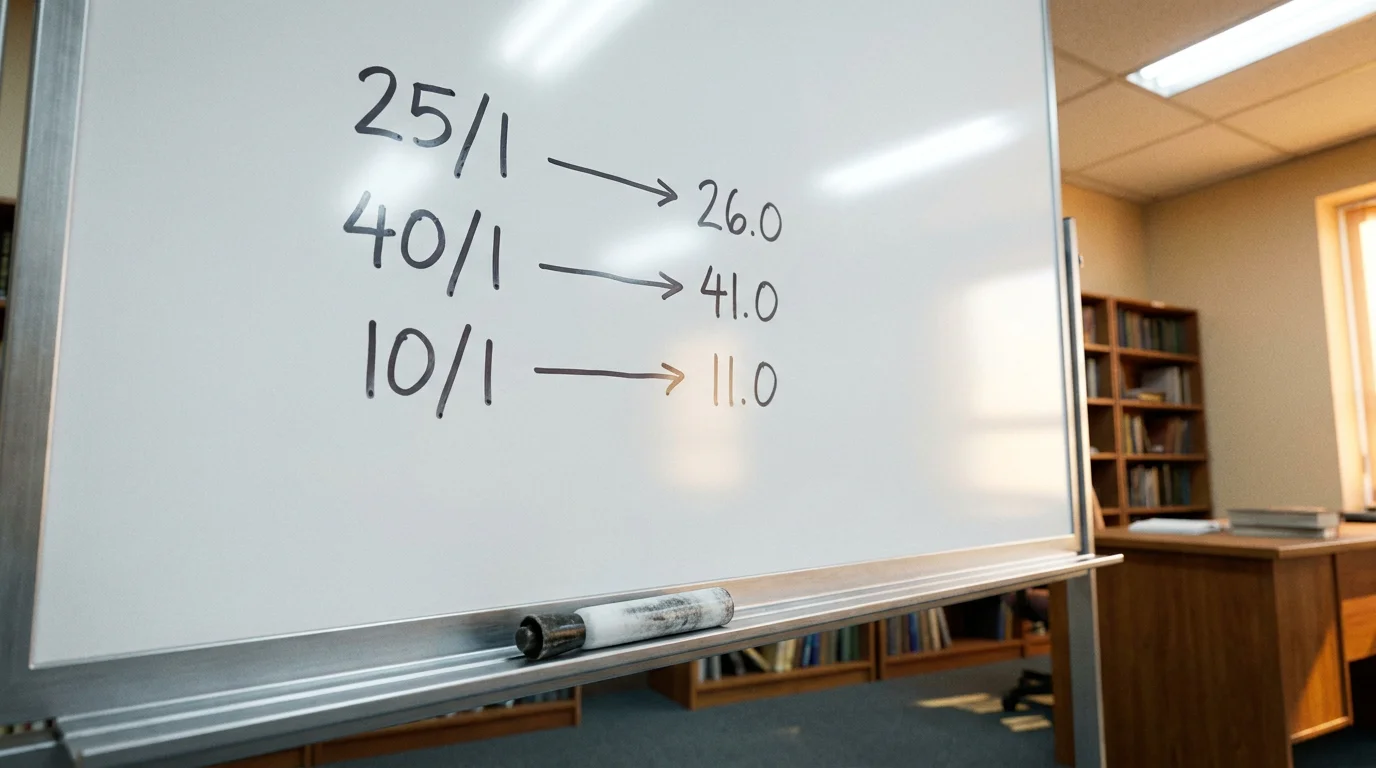
I still remember the confusion on my mate’s face when he switched from a UK bookmaker showing 25/1 to a European exchange showing 26.0. “Is that better or worse?” he asked. It’s the same price, expressed differently. But if you can’t convert between the two formats fluently, you’ll struggle to compare odds across operators — and comparison is where edge lives.
Fractional odds, the traditional UK format, express profit relative to stake. Odds of 25/1 mean you profit 25 pounds for every 1 pound staked. Your total return is 26 pounds (25 profit plus your 1-pound stake back). The denominator is always the stake reference, and the numerator is the profit. Shorter prices like 5/2 mean 2.50 pounds profit for every 1 pound staked, returning 3.50 in total. Some fractional prices use larger numbers: 100/30 is the same as 10/3, which is 3.33 pounds profit per pound staked.
Decimal odds, the continental European and exchange format, express total return per unit staked. Decimal odds of 26.0 mean a 1-pound bet returns 26 pounds total (including the stake). To find the profit, subtract 1.0: 26.0 – 1.0 = 25.0 profit per pound, which is identical to 25/1 fractional. A decimal price of 3.50 is the same as 5/2 fractional: 3.50 total return minus 1.0 stake equals 2.50 profit.
Converting between the two formats is straightforward. Fractional to decimal: divide the numerator by the denominator and add 1. So 40/1 becomes (40/1) + 1 = 41.0 decimal. For non-integer fractions: 5/2 becomes (5/2) + 1 = 3.50. Decimal to fractional: subtract 1, then express as a fraction. 41.0 becomes 40/1. 3.50 becomes 5/2 (or 2.5/1, simplified to 5/2).
Why does this matter beyond convenience? Because betting exchanges — where you bet against other punters rather than against a bookmaker — display decimal odds exclusively. If you’re comparing a bookmaker’s 33/1 fractional price against an exchange lay of 36.0 decimal, you need to convert to the same format to see that the exchange is offering 35/1 in fractional terms and thus represents a better price. In golf, where a single point of odds at longer prices corresponds to meaningful expected value, the ability to compare across formats isn’t academic — it’s material.
My personal preference is decimal for analysis and fractional for quick mental maths. When I’m building a spreadsheet model, decimal is cleaner: multiply the stake by the decimal odds to get the total return, no separate profit calculation needed. When I’m glancing at a coupon on my phone and want to gauge whether a price is worth investigating, fractional gives me an instant gut read. Use whichever you’re comfortable with, but be able to read both without hesitation.
How Bookmakers Price a 156-Player Golf Field
I once asked a former bookmaker trader how they set golf outright odds for a standard PGA Tour event. His answer: “The top 20 players are priced carefully. The next 30 are priced by model. The bottom 100 are priced by formula.” That hierarchy explains most of the pricing inefficiencies I’ve exploited over nine years.
The process starts weeks before the event, when ante-post markets open. At this stage, the field isn’t confirmed, so bookmakers price a provisional list based on the expected entrants. The top contenders are priced off detailed models that incorporate world ranking, recent Strokes Gained data, course history, fitness reports and even travel schedules. These prices are tightly managed, frequently updated and closely aligned across operators — because the top of the market is where the biggest liabilities sit.
The middle tier — players ranked roughly 30th to 60th in the betting — receives less individual attention. Bookmakers typically use a semi-automated model that inputs ranking, recent finishing positions and a generic course-fit rating. The output is a base price that a human trader may adjust by a few points based on market intelligence (how other bookmakers have priced the player, what the exchange market is showing). The handle on PGA Tour events has grown at 30-35% annually over several consecutive years, and that growth has pushed bookmakers to extend their pricing deeper into the field. But “deeper” doesn’t mean “more careful” — it means more players priced by less sophisticated methods.
The long tail — players from 60th in the betting down to the 156th and last — is priced almost entirely by formula. World ranking in, price out. These are the 80/1 to 300/1 shots where the bookmaker’s model assigns a near-zero win probability and sets a price that’s broadly in line with that estimate plus margin. The individual attention given to each of these players is minimal, which is precisely why this segment of the market produces the most pricing errors. A 100/1 shot who’s been in exceptional recent form on a course that suits his specific skill set might be priced no differently from a 100/1 shot who’s missed four cuts in a row — because the formula doesn’t distinguish between them.
The US golf betting market was estimated at 3.5 billion dollars in 2023, and that figure has only grown since. More money in the market means more sophisticated pricing at the top end — the short-priced favourites are harder to beat than ever. But the depth of a 156-player field means the bookmaker’s resources are spread thin. The edges are at the margins, in the players that the formula prices but the trader doesn’t interrogate. That’s where your research advantage is strongest.

The Overround: Where the Bookmaker’s Margin Lives
Here’s a number that should bother you: in a perfectly fair market, the implied probabilities of all outcomes would sum to exactly 100%. In a typical golf outright market, they sum to somewhere between 130% and 160%. That difference — the overround — is the bookmaker’s built-in profit margin, and it’s the tax you pay on every bet.
The overround works like this. Suppose a bookmaker prices two players in a head-to-head matchup. If the odds were fair, Player A at 10/11 (implied probability 52.4%) and Player B at 10/11 (implied probability 52.4%) would sum to 104.8%. The 4.8 percentage points above 100% is the overround — the margin the bookmaker expects to retain regardless of which player wins. In a two-outcome market, 4-5% overround is typical. In a 156-player outright market, the overround is dramatically higher because every player’s price is slightly shorter than the “true” fair odds.
The UK gambling industry generated 11.5 billion pounds in gross gaming yield between April 2023 and March 2024, growing 5.7% year-on-year. That yield is funded by overround across every sport and every market — golf included. Understanding overround doesn’t eliminate it, but it does change how you allocate your bets. A market with a 135% overround is giving you less value per pound staked than one with a 120% overround, even if the headline price on your specific selection looks identical.
To calculate overround, convert every price in the market to implied probability (we’ll cover the formula in the next section), sum all the probabilities, and subtract 100%. A golf outright market with 156 players where each player’s odds imply a total of 145% has an overround of 45%. That means, on average, each player’s price is roughly 45/156 = 0.29 percentage points shorter than fair. At the top of the market (short prices), this compression is more noticeable in absolute return terms; at the bottom (long prices), it’s less noticeable per bet but still erodes long-term value.
The practical takeaway: overround varies between bookmakers and between events. Major championships with heavy betting interest tend to have lower overrounds because bookmakers compete more aggressively on price. Smaller events with less liquidity carry higher overrounds. Always check the overround before deciding where to place your bet — it’s one of the simplest ways to identify which operator is offering the most competitive market on a given week.
From Odds to Implied Probability — A Quick Intro
Every set of odds is a probability estimate wearing a disguise. Strip away the format and the margin, and what’s left is the bookmaker’s assessment of how likely an outcome is. Learning to see through the disguise is the single most useful analytical skill in golf betting.
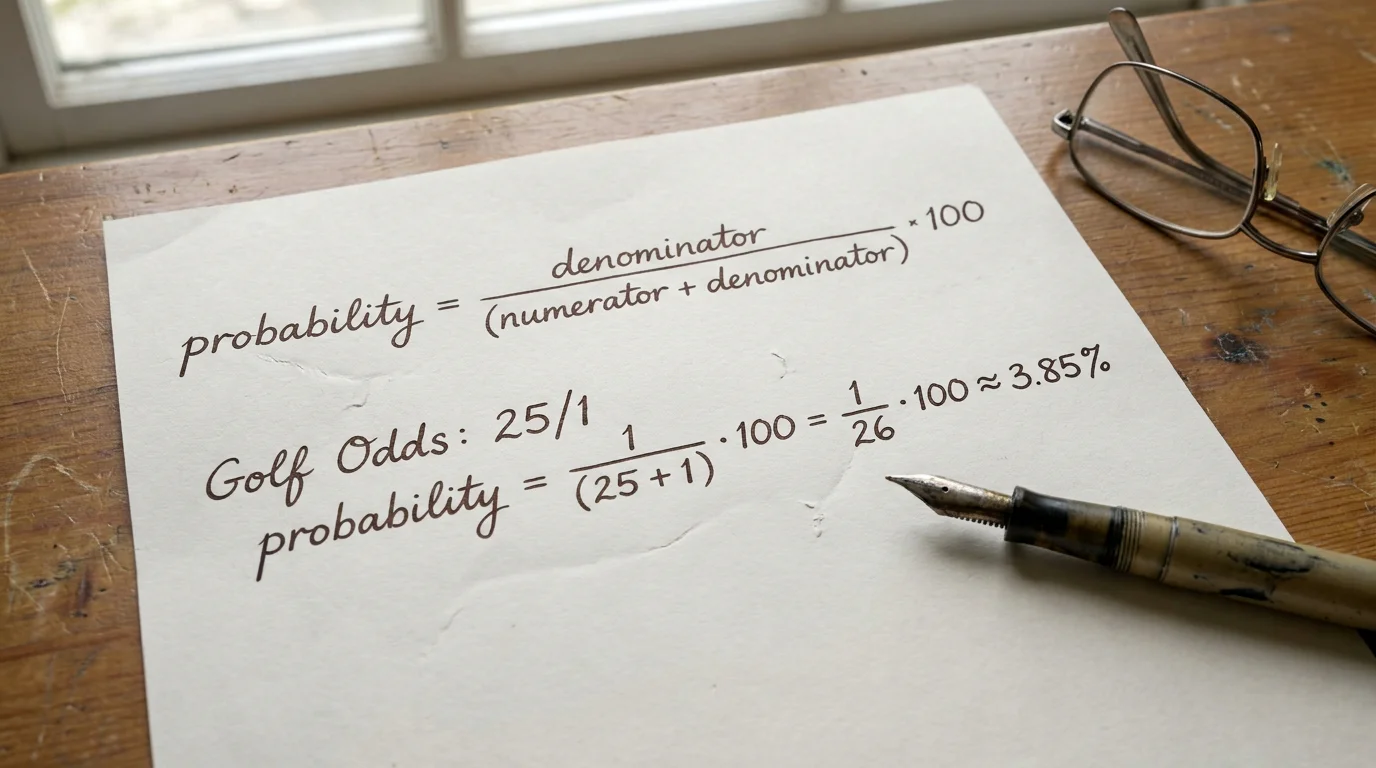
The conversion formula for fractional odds is: implied probability = denominator / (numerator + denominator) x 100. For 25/1: 1 / (25 + 1) x 100 = 3.85%. For 5/2: 2 / (5 + 2) x 100 = 28.57%. For decimal odds, it’s even simpler: implied probability = (1 / decimal odds) x 100. For 26.0 decimal: 1 / 26.0 x 100 = 3.85%. For 3.50 decimal: 1 / 3.50 x 100 = 28.57%.
These percentages include the bookmaker’s overround, so they overstate the true probability. To derive “fair” odds — what the price would be without the margin — you need to remove the overround. The simplest method is proportional: divide each player’s implied probability by the total overround percentage, then convert back to odds. If the total implied probability sums to 140% and your player’s implied probability is 7%, their “fair” probability is 7/140 x 100 = 5%, which corresponds to fair odds of 19/1 fractional or 20.0 decimal.
I use implied probability conversion on every bet I assess. The workflow is mechanical: convert the odds, strip the margin, compare the fair probability to my own estimate. If my estimate is higher than the fair probability, there’s potential value. If it’s lower, there isn’t. No narrative, no gut feel — just numbers compared to numbers. It takes 30 seconds per player and saves you from the most common mistake in golf betting: backing a player because you “like” them rather than because the price is wrong.
Why Golf Odds Drift and Shorten
I backed a player at 80/1 on Tuesday morning for a Thursday-start PGA Tour event. By Wednesday evening, he was 50/1. I hadn’t placed a massive bet. Nobody had leaked injury news. The odds moved because the market moved — and understanding why the market moves is essential to knowing when to strike and when to wait.
Golf odds shorten (get shorter, meaning a smaller payout) for three primary reasons. First, money: when a significant volume of bets lands on a player, the bookmaker shortens the price to reduce liability. This can be driven by sharp bettors (professional or semi-professional punters whose action bookmakers respect) or by volume from recreational punters following a media tip. Second, information: a positive practice-round report, a favourable tee-time draw or a confirmed equipment change can trigger price movement before the tournament begins. Third, market alignment: if one bookmaker shortens a player’s price, others follow to avoid being the outlier offering the best available odds and attracting disproportionate action.
Odds drift (lengthen) for the inverse reasons: money on other players draws attention away, negative information emerges (minor injury reports, poor practice-round buzz), or the field strengthens with a late entry that compresses the probability distribution. Scott Warfield has spoken about the “stickiness” of golf’s betting audience — once engaged, punters stay — and that growing, sticky audience generates more pre-tournament betting activity, which in turn produces more pre-tournament odds movement than we saw even three or four years ago.

For practical purposes, the timing of your bet matters. Ante-post prices (available days or weeks before the event) are typically the longest, because they carry withdrawal risk and the market hasn’t yet absorbed the full information set. Prices tighten as the tournament approaches, and the sharpest compression usually happens between Tuesday and Thursday morning as tee times are published and the final wave of pre-tournament money arrives. My default is to place outright and each-way bets on Tuesday or Wednesday — early enough to capture the longer price, late enough that the field is confirmed and I’m not exposed to unnecessary withdrawal risk.
Comparing Lines Across Bookmakers
The laziest habit in golf betting is placing every bet with the same bookmaker. I did it for my first two years and left hundreds of pounds on the table. The reason is simple: different bookmakers price the same player differently, sometimes by significant margins. A player at 50/1 with one operator might be 66/1 with another. On a 10-pound each-way bet, that difference is worth roughly 40 pounds in place returns alone. Multiply that across a season of 60-80 bets, and the cumulative impact on your P&L is substantial.
Line comparison — shopping for the best available odds before placing a bet — is the lowest-effort, highest-impact improvement most golf punters can make. It requires accounts with multiple UK-licensed bookmakers (three is a minimum, five is better) and a few minutes of comparison before each bet. Odds aggregation websites display side-by-side pricing for the major golf markets, which makes the process even faster.
The variance in pricing is largest in two segments of the market. At the top, where the favourite and second favourite are priced, differences of one or two points (e.g. 8/1 vs 10/1) are common and meaningful at higher stakes. At the long end, where 80/1 to 200/1 players sit, differences of 10-20 points are routine because each bookmaker’s formula produces a slightly different output for low-attention players. A player at 80/1 with one bookmaker and 100/1 with another represents a 25% difference in implied probability — an enormous gap that wouldn’t exist in a more heavily traded market.
Each-way terms add another dimension to the comparison. Two bookmakers might offer the same outright price but different each-way terms — one at 1/4 for five places, the other at 1/5 for eight. As I’ve discussed elsewhere, the optimal choice depends on the player’s price and placing probability. Always compare the total expected return of the each-way bet (win part plus place part), not just the headline outright price.
I maintain a simple spreadsheet that records which bookmaker offered the best price on each of my bets. Over a calendar year, the aggregate improvement from consistent line shopping is typically 8-12% of total stake turnover. That’s the difference between a marginally losing record and a marginally winning one — achieved not through better analysis or smarter selections, but through the mechanical discipline of checking three extra websites before clicking “place bet.”

Golf Betting Odds FAQ
Why are golf outright odds so much higher than in football or tennis?
Field size is the primary driver. A standard PGA Tour event has 156 players competing for one trophy, so even the strongest favourite has only an 8-12% implied chance of winning — corresponding to odds of roughly 7/1 to 11/1. In football, a two- or three-outcome market concentrates probability into much shorter prices. In tennis, a two-player match does the same. Golf’s large field distributes probability across dozens of credible contenders, which pushes every player’s odds longer.
How do golf odds compare between fractional and decimal formats?
They express the same information differently. Fractional odds of 40/1 are identical to decimal odds of 41.0. To convert fractional to decimal, divide the first number by the second and add 1. To convert decimal to fractional, subtract 1 and express the result as a fraction. UK bookmakers default to fractional; exchanges and European operators use decimal. Being fluent in both lets you compare prices across platforms instantly.
Do odds shorten more for big-name players regardless of form?
Partially. Marquee names attract disproportionate recreational money, which forces bookmakers to shorten their prices to manage liability. This means high-profile players are often slightly shorter than their form-based probability warrants, while lesser-known players with comparable or better recent form are longer. This name-recognition premium is one of the most consistent pricing inefficiencies in golf betting and a source of value for punters who focus on data rather than reputation.
What is a good overround percentage to look for in golf markets?
For a PGA Tour outright market, overrounds typically range from 125% to 155%. Major championships tend to sit at the lower end because of competitive bookmaker pricing. Anything below 130% is sharp. Above 145% indicates a less competitive market where you are paying a higher implicit tax on each bet. Compare overrounds across bookmakers for the same event — if one operator runs a 130% book and another runs 150%, your money goes further at the first.
